Showing posts with label november. Show all posts
Showing posts with label november. Show all posts
Tuesday, April 8, 2014
Existing Home Sales Surged in November
Existing home sales continued their strong recent trend in November, gaining 5.9% from the previous month to reach an annualized pace of 5.0 million units. November’s pace is 14.5% above the pace seen one year ago, this is the strongest growth in over three years. Although Hurricane Sandy caused disruptions in affected areas, gains elsewhere more than offset the weakness.

Although Hurricane Sandy caused disruptions in the Northeast, the region was resilient, seeing a 6.9% increase in home sales. The Midwest and South both saw strong gains in November as well, increasing 7.2% and 7.9% respectively. The West continues to lag the recovery, improving just 0.5% in November.
Distressed sales accounted for just 22% of sales in November, down from 24% the previous month and 29% one year ago. As a result of the falling share of distressed homes, median prices rose, reaching $180,600 in November, a 2.0% improvement month-over-month and 10.1% above year-ago levels.
The supply of existing homes on the market continues to tighten from historically low levels. Supply fell for the fifth consecutive month, reaching 4.8 months in November, its lowest level in over seven years. Supply of existing homes on the market is now 32% below year-ago levels.
Read the NAR report.
ReadThe RestEntry..
Although Hurricane Sandy caused disruptions in the Northeast, the region was resilient, seeing a 6.9% increase in home sales. The Midwest and South both saw strong gains in November as well, increasing 7.2% and 7.9% respectively. The West continues to lag the recovery, improving just 0.5% in November.
Distressed sales accounted for just 22% of sales in November, down from 24% the previous month and 29% one year ago. As a result of the falling share of distressed homes, median prices rose, reaching $180,600 in November, a 2.0% improvement month-over-month and 10.1% above year-ago levels.
The supply of existing homes on the market continues to tighten from historically low levels. Supply fell for the fifth consecutive month, reaching 4.8 months in November, its lowest level in over seven years. Supply of existing homes on the market is now 32% below year-ago levels.
Read the NAR report.

Thursday, March 27, 2014
Consumer Credit Continued Strong Growth in November
Consumer credit continued its recent surge in November, rising $16 billion over the previous month’s level. As has been the case for some time, the majority of the growth in consumer credit is driven by gains in non-revolving credit. Consumer credit has now gained more than $10 billion per month for the past four months, after a surprise decline in July.

The gains in revolving credit were relatively modest, gaining $800 million over the month. Revolving credit has been up and down throughout 2012, rising in six and falling in five of the months.
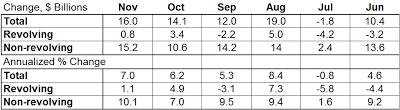
Non-revolving credit continues to drive overall growth, rising 10.1% in November ($15.2 billion). November marks the 15th consecutive gain for non-revolvoing balances. Non-revolving debt growth has been driven primarily by growth in student loans, accounting for 62% of the growth in non-revolving credit on a non-seasonally adjusted basis.

Read the Fed release.
ReadThe RestEntry..
The gains in revolving credit were relatively modest, gaining $800 million over the month. Revolving credit has been up and down throughout 2012, rising in six and falling in five of the months.
Non-revolving credit continues to drive overall growth, rising 10.1% in November ($15.2 billion). November marks the 15th consecutive gain for non-revolvoing balances. Non-revolving debt growth has been driven primarily by growth in student loans, accounting for 62% of the growth in non-revolving credit on a non-seasonally adjusted basis.
Read the Fed release.
Wednesday, March 5, 2014
Existing Home Sales Rose In November
Existing home sales increased in November, rising 4% to an annualized pace of 4.42 million units according to a National Association of Realtors report released this morning. Despite the encouraging growth this report included significant downward revisions to sales dating as far back as January 2007. Even with the downward revisions sales have grown 12.2% year-over-year in November. Some of this year-over year strength can be attributed to slow sales in November 2010 following the expiration of the federal homebuyer tax credit.

Existing home sales were revised down by 14.5% from a pace of 4.97 million to 4.25 million. These revisions extended all of the way to the beginning of 2007. The revisions reduced 2010 existing home sales by nearly 14.8%. There were also significant revisions in the number of homes listed for sale. Despite these revisions historical growth rates for existing home sales remain relatively unchanged.
Growth in November was seen across all regions, with the Northeast posting the strongest gains of 9.8% in November. The South saw the least improvement, rising 2.4% in November.
The months of homes available for sale continued to fall in November to 7.0, down from 7.7 the previous month. After incorporating downward revisions, this is the lowest level seen this year. These declines have been led by falling home inventory, rather than strong sales growth.
The median home price rose to $164,200 in November, up from $160,800 last month. Despite this, home sales remain 3.5% below their level one year ago.
Read the report.
ReadThe RestEntry..
Existing home sales were revised down by 14.5% from a pace of 4.97 million to 4.25 million. These revisions extended all of the way to the beginning of 2007. The revisions reduced 2010 existing home sales by nearly 14.8%. There were also significant revisions in the number of homes listed for sale. Despite these revisions historical growth rates for existing home sales remain relatively unchanged.
Growth in November was seen across all regions, with the Northeast posting the strongest gains of 9.8% in November. The South saw the least improvement, rising 2.4% in November.
The months of homes available for sale continued to fall in November to 7.0, down from 7.7 the previous month. After incorporating downward revisions, this is the lowest level seen this year. These declines have been led by falling home inventory, rather than strong sales growth.
The median home price rose to $164,200 in November, up from $160,800 last month. Despite this, home sales remain 3.5% below their level one year ago.
Read the report.
Friday, February 14, 2014
Retail Sales Increased 0 3 in November
Retail sales reversed the previous month’s loss in November, rising 0.3%. Auto dealers were primarily responsible for the gain, as core sales (excluding autos and gasoline) rose by just 0.7%. Despite the modest overall rise there were big moves within individual segments. Year-over-year growth held steady at 3.7% in November.

Non-store retailers saw strong gains in November rising 3% over the previous month, about three times their recent average. The strong growth contributed 0.3% to overall growth. Electronics and appliances stores also saw strong growth, rising 2.5%. Rebuilding from Hurricane Sandy likely contributed to the strong 1.6% growth in sales at building materials stores.
Sales fell the most sharply at Gasoline stations, falling 4.0% over the month. The decline in gasoline sales was likely a direct result of lower gasoline prices. Sales also fell unusually sharply at general stores, which were down 0.9%.
Read the Census report.
ReadThe RestEntry..
Non-store retailers saw strong gains in November rising 3% over the previous month, about three times their recent average. The strong growth contributed 0.3% to overall growth. Electronics and appliances stores also saw strong growth, rising 2.5%. Rebuilding from Hurricane Sandy likely contributed to the strong 1.6% growth in sales at building materials stores.
Sales fell the most sharply at Gasoline stations, falling 4.0% over the month. The decline in gasoline sales was likely a direct result of lower gasoline prices. Sales also fell unusually sharply at general stores, which were down 0.9%.
Read the Census report.
Wednesday, February 5, 2014
Housing Starts Jumped 9 3 in November
Housing starts rose to 685,000 annualized units in November, up 9.3% from the revised October pace. Permit issuance continues to grow as well, rising 5.7% in November. This suggests that the rate of new construction could continue to accelerate.

The more volatile multi-family starts lead growth, jumping 25.3% to an annualized rate of 238,000 units. Single-family starts grew less rapidly at 2.3%, but still account for the majority of starts at an annual pace of 447,000 units.
Permit issuance trends suggest that gains will continue in December as permit issuance grew by 5.7% to an annualized level of 681,000 permits. The issuances suggest that multi-family starts are likely to continue driving growth, as multi-family permits grew by 13.9%. Single-family permits rose by 1.6%.
Although the growth in housing starts is encouraging, it is growing from a low base. Historically housing starts are near 1.5 million units per year. Although we have seen some recovery, we are a long way off from those levels.
Read the report.
ReadThe RestEntry..
The more volatile multi-family starts lead growth, jumping 25.3% to an annualized rate of 238,000 units. Single-family starts grew less rapidly at 2.3%, but still account for the majority of starts at an annual pace of 447,000 units.
Permit issuance trends suggest that gains will continue in December as permit issuance grew by 5.7% to an annualized level of 681,000 permits. The issuances suggest that multi-family starts are likely to continue driving growth, as multi-family permits grew by 13.9%. Single-family permits rose by 1.6%.
Although the growth in housing starts is encouraging, it is growing from a low base. Historically housing starts are near 1.5 million units per year. Although we have seen some recovery, we are a long way off from those levels.
Read the report.
Monday, January 13, 2014
Producer Prices Fell in November
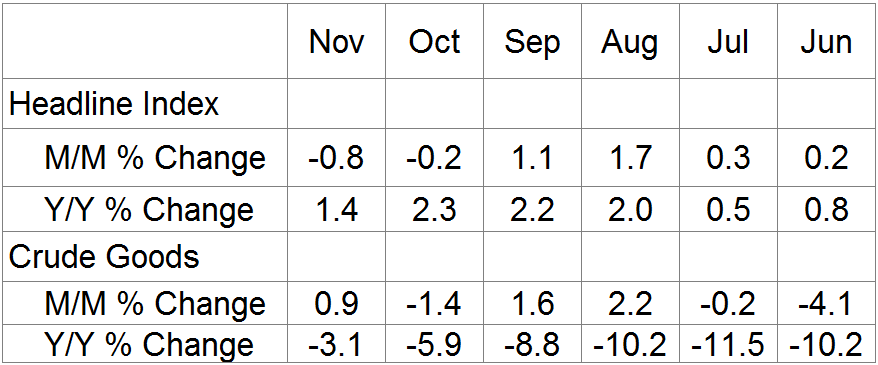
Producer prices fell for the second consecutive month in November, dropping 0.8% over the month. A sharp drop in energy prices more than offset a modest rise in the prices of core goods and food. Finished core goods saw prices appreciate just 0.1% in November, rebounding from their 0.2% decline the previous month.

Prices for finished energy products fell 4.6% in November, the sharpest drop in over three years. The decline was driven almost entirely by a 10% plunge in gasoline prices. Food prices rose 1.3% in November, up from a moderate 0.4% the previous month.
Producer prices are now only 1.4% above year-ago levels, considerably weaker than the 2.3% reported last month. Producer price appreciation has slowed notably from the rapid pace seen over the summer and will likely drag on consumer prices in coming months.
Read the BLS report.
ReadThe RestEntry..
Prices for finished energy products fell 4.6% in November, the sharpest drop in over three years. The decline was driven almost entirely by a 10% plunge in gasoline prices. Food prices rose 1.3% in November, up from a moderate 0.4% the previous month.
Producer prices are now only 1.4% above year-ago levels, considerably weaker than the 2.3% reported last month. Producer price appreciation has slowed notably from the rapid pace seen over the summer and will likely drag on consumer prices in coming months.
Read the BLS report.
Thursday, August 29, 2013
ADP Employment Increased by 118 000 Jobs in November
ADP’s National Employment Report indicated that the private sector increased employment by 118,000 jobs in November. Although November’s growth is lower than October’s 157,000, it is still a strong result given the effects of Hurricane Sandy. ADP estimates that the effects of Sandy cut 86,000 jobs from payrolls in November. Accounting for this effect, ADP estimates November’s employment would have risen by 204,000 jobs.

In October, ADP moved to a new methodology of calculating payroll employment, designed to ensure that employment numbers line up more closely with the BLS’s employment situation. The 157,000 jobs created in October, translated to growth of 171,000 jobs as reported by the BLS.
The report indicates that the service sector continues to drive job creation, accounting for 114,000 of the jobs created in November. November’s service sector growth represents a slowing from the 149,000 jobs the sector created in October. The goods producing sector also slowed in November, creating 4,000 jobs, less than the 8,000 jobs created in October. The manufacturing sector remains weak, shedding jobs for the past five months.
Read the ADP report.
ReadThe RestEntry..

In October, ADP moved to a new methodology of calculating payroll employment, designed to ensure that employment numbers line up more closely with the BLS’s employment situation. The 157,000 jobs created in October, translated to growth of 171,000 jobs as reported by the BLS.
The report indicates that the service sector continues to drive job creation, accounting for 114,000 of the jobs created in November. November’s service sector growth represents a slowing from the 149,000 jobs the sector created in October. The goods producing sector also slowed in November, creating 4,000 jobs, less than the 8,000 jobs created in October. The manufacturing sector remains weak, shedding jobs for the past five months.
Read the ADP report.
Saturday, June 1, 2013
Trade Gap Unexpectedly Widened in November
In November the trade deficit unexpectedly widened to its largest level since April due to a surge in imports. The November trade gap widened to $48.7 billion from 42.1 billion. The trade gap has remained under $43 billion for the past five months prior to November’s jump.

A small rise in exports was not enough to offset the surge of imports seen in November that pushed the deficit wider. Exports rose 1.0% in November to $183 billion. Imports, however surged 3.8% rising to $231 billion.
The real goods deficit, which is important for the calculation of GDP, rose 12.8% to $51.9 billion.
Read the Census report.
ReadThe RestEntry..

A small rise in exports was not enough to offset the surge of imports seen in November that pushed the deficit wider. Exports rose 1.0% in November to $183 billion. Imports, however surged 3.8% rising to $231 billion.
The real goods deficit, which is important for the calculation of GDP, rose 12.8% to $51.9 billion.
Read the Census report.
Wednesday, May 29, 2013
Housing Starts Slowed in November
New residential construction slowed somewhat in November, reaching an annual rate of 861,000 units, down from 888,000 the previous month. Despite November’s mild decline, housing starts remain 15% above levels seen as recently as August, at nearly the fastest pace since early 2008. In the past year, the pace of new home construction has increased 21.6%.

Single-family starts led the decline in November, falling 4.1% over the month. Despite the strong loss, single-family starts remain near their fastest pace in over four years and maintain a positive trend.

Permit issuance rose in November, rising 3.6% to an annual pace of 899,000 permits. Strong permit issuance points to a continuing recovery in housing construction. Total permit issuance is up 26.8% from year-ago levels.
Read the Census report.
ReadThe RestEntry..

Single-family starts led the decline in November, falling 4.1% over the month. Despite the strong loss, single-family starts remain near their fastest pace in over four years and maintain a positive trend.

Permit issuance rose in November, rising 3.6% to an annual pace of 899,000 permits. Strong permit issuance points to a continuing recovery in housing construction. Total permit issuance is up 26.8% from year-ago levels.
Read the Census report.
Monday, May 27, 2013
Personal Income Grew 0 6 in November
Personal income growth outpaced consumption growth in November, rising 0.6% and leading the savings rate to tick up slightly. Novembers growth was the fastest rate since February. Hurricane Sandy played a role in Novembers strength, as it depressed growth in October, leading to a rebound in November.

The improvement in personal income was welcome, as growth has averaged just 0.2% over the past 7 months. Real personal income preformed better than nominal rising 0.8% due to a falling PCE index. Wage income rose 0.6% in November as well, recovering from a 0.3% drop the previous month.
Consumption recovered in November, rising 0.4% over the month after falling in October. Consumption gains were led by durable goods purchases, which rose 2.7% over the month. Some of this strength is due to auto sales delayed by Sandy. Non-durable goods purchases fell for the second consecutive month in November, losing 1.0%.
Consumer prices, as measured by the PCE deflator, fell 0.2% in November, their first decline since May. Much of the decline was due to energy prices falling 4.4%. Core prices remained unchanged.
With income growth outpacing spending growth, the savings rate rose 0.2 points to 3.6%. November is the second month the savings rate has improved, putting it on par with Augusts level.
Read the BEA report.
ReadThe RestEntry..

The improvement in personal income was welcome, as growth has averaged just 0.2% over the past 7 months. Real personal income preformed better than nominal rising 0.8% due to a falling PCE index. Wage income rose 0.6% in November as well, recovering from a 0.3% drop the previous month.
Consumption recovered in November, rising 0.4% over the month after falling in October. Consumption gains were led by durable goods purchases, which rose 2.7% over the month. Some of this strength is due to auto sales delayed by Sandy. Non-durable goods purchases fell for the second consecutive month in November, losing 1.0%.
Consumer prices, as measured by the PCE deflator, fell 0.2% in November, their first decline since May. Much of the decline was due to energy prices falling 4.4%. Core prices remained unchanged.
With income growth outpacing spending growth, the savings rate rose 0.2 points to 3.6%. November is the second month the savings rate has improved, putting it on par with Augusts level.
Read the BEA report.
Monday, May 20, 2013
ISM Nonmanufacturing Slowed in November
The service industry weakened in November as measured by the ISM nonmanufacturing index, which fell from 52.9 to 52.0. This marks the third consecutive monthly decline, leaving the index below its third quarter average of 53.0. Despite the negative headline number, the details are not quite as negative. Furthermore, the number does not line up with other recent data on the services industry.

In November business activity picked up substantially, rising to 56.2 from 53.8. New orders rose as well, to 53.0 from 52.4.
The employment aspect of the index accounted for the biggest loss, falling from an expansionary 53.3 to a contracting 48.9, indicating jobs were lost in November. This is discouraging, however other data suggests employment gains in the service sector. Supplier deliveries fell 2 points to 50.0, the breakeven point between expansion and contraction.
There was an improvement in trade details as well with exports growing to 55.5, and imports growing mildly to 48.5. Inventories recovered in November as well, rising from 45.5 to 52.5.
Read the report.
ReadThe RestEntry..

In November business activity picked up substantially, rising to 56.2 from 53.8. New orders rose as well, to 53.0 from 52.4.
The employment aspect of the index accounted for the biggest loss, falling from an expansionary 53.3 to a contracting 48.9, indicating jobs were lost in November. This is discouraging, however other data suggests employment gains in the service sector. Supplier deliveries fell 2 points to 50.0, the breakeven point between expansion and contraction.
There was an improvement in trade details as well with exports growing to 55.5, and imports growing mildly to 48.5. Inventories recovered in November as well, rising from 45.5 to 52.5.
Read the report.
Subscribe to:
Posts (Atom)